Didim Property Outlook 2026:
The Rise of Seyrantepe & Yeşiltepe
In a district whose population grew 176% in 21 years, land-parcel activity clusters in a single neighbourhood. A data-driven portrait of the Seyrantepe–Yeşiltepe area: a complete 508-listing supply census, a 16-year official transaction series and a currency-adjusted price analysis.
1 · The 100k threshold: Didim is no longer a small coastal town
Didim's population was 37,395 in 2004. By the end of 2025 it stood at 103,141 — a 176% increase in 21 years, several times the national average. This is not seasonal tourism swell; it is registered, year-round residency. Retirement migration, remote work and an inland-to-coast settlement wave keep enlarging the district's permanent housing need.
Didim population: 2004 → 2025
Source: TurkStat Address-Based Population Registration System
2 · The heart of parcel activity: a single red zone
According to the Land Registry's (TKGM) parcel-level transaction-density analysis, the only high-density cluster on Didim's 2025 map is Akyeniköy — the neighbourhood containing Seyrantepe and Yeşiltepe. Nothing comparable appears anywhere else in the district, including the Altınkum coast, the town centre or Akbük.
Reading this map correctly matters: the layer counts at parcel level. In the town centre and Altınkum most sales are condominium flats — hundreds of independent units on a single parcel collapse into one point on the map and generate no density. In Akyeniköy every sale is a separate land parcel. The map therefore shows where parcel/land turnover concentrates, not where homes sell; housing sales in the centre and Akbük are of course substantial, and the district-wide official housing picture is given by the TurkStat series in Section 7.
The yearly series tells the area's story: averaging ~980 activity points a year in 2010-2014, the neighbourhood jumped to the 3,000-4,500 band with the 2015-16 cooperative-conversion wave, then peaked at 5,491 in 2021 — 5.6× the 2010 level. In 2024-25 the series settled back to 1,900-2,100, still roughly double a decade ago.
2025 transaction density — Seyrantepe & Yeşiltepe
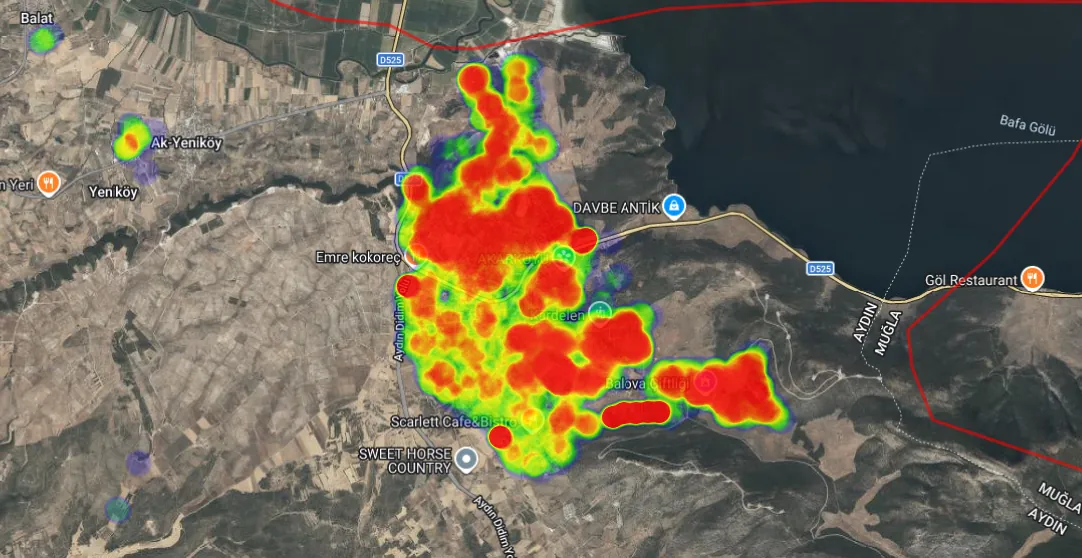
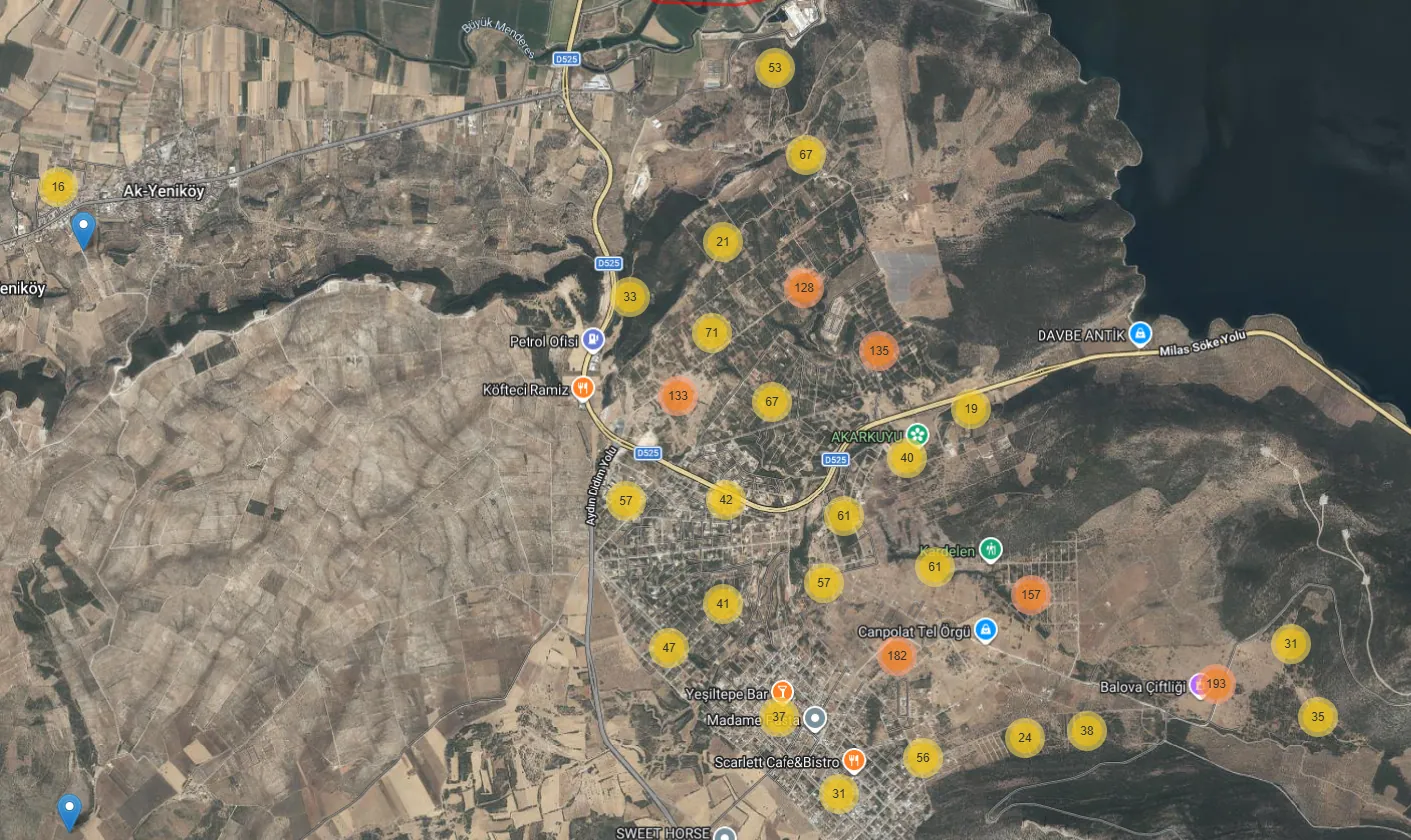
Source: TKGM Parcel Query application, transaction-density analysis, 2025 (public data, accessed 09.07.2026)
Akyeniköy — annual parcel activity points (2010-2025)
Source: TKGM Parcel Query / GIS analysis service, transaction-density layer (retrieved 09.07.2026)
3 · The supply picture: still in the "plot phase"
In July 2026 we counted every active sale listing in Akyeniköy, one by one: 508 plots and 80 homes. 86% of supply is land — the signature of the earliest stage on a district's development curve. For comparison, mature coastal neighbourhoods show the reverse. And 64% of the housing supply is villas: this is a detached-living market, not an apartment one.
Composition of active listings — Akyeniköy, July 2026
Source: RedRock full supply census, sahibinden.com Ak-Yeniköy, 09.07.2026 (duplicates removed)
Land supply splits into two clear classes: 300-350 m² newly subdivided plots (Balova, Kardelen) making up 54% of the market, and 500-760 m² classic villa plots at 29%. The striking part: unit prices normally fall as plots get bigger — here the pattern reverses —
The large-plot premium — median unit price (TL/m²)
The 600-700 m² "full villa plot" is scarce and carries a premium · RedRock census (n=495)
4 · The price ladder: maturity is priced in
Median unit prices by location draw a clean ladder: newest subdivision Balova at 4,860 TL/m², Kardelen 5,500, Seyrantepe 6,510 and the most established, Yeşiltepe, at 8,050 TL/m². Yeşiltepe carries a 24% premium over Seyrantepe — the numerical expression of this report's core thesis: Seyrantepe today is where Yeşiltepe stood 5-10 years ago. (Get to know the areas: Seyrantepe guide · Yeşiltepe guide) A gap expected to narrow as infrastructure and settlement density build up.
Location premium ladder — median land unit price (TL/m²)
Source: RedRock supply census (location from listing titles, n=495) · cross-validated with Endeksa's neighbourhood average (5,455 TL/m²)
The entry ticket remains low: 56% of listings sit below 2.5 million TL. The villa-plot segment concentrates in the 4-6 million band.
Land prices by segment — Akyeniköy, July 2026
| Plot class | Listings | Median price | Median unit |
|---|---|---|---|
| 300-350 m² (new subdivision) | 279 | 1,50 M TL | 4.860 TL/m² |
| 351-499 m² | 48 | 3,13 M TL | —* |
| 500-630 m² (villa plot) | 87 | 3,85 M TL | 6.790 TL/m² |
| 631-760 m² (villa plot) | 64 | 5,08 M TL |
*The 351-499 band is small and mixed; its unit price should not be read alone. All prices are asking prices. · RedRock census, 09.07.2026
Home prices by segment — same area, for context
| Segment | Listings | Median price | Range |
|---|---|---|---|
| Studio / 1-bed (new-build complexes) | 9 | 3,0 M TL | 2,65 – 7,3 M |
| 2+1 / 2+2 | 19 | 3,9 M TL | 3,05 – 17,75 M |
| 3-bed and larger (villa class) | 52 | 14,75 M TL | 3,25 – 38 M |
Housing data is for context: that a 600-700 m² plot plus construction can total below the ready-villa median is the economic case behind the area's "buy land, build" preference. · RedRock census
Çeşme and Bodrum make a useful yardstick: both are mature markets whose settlement and tourism planning go back decades, and their price base has long reflected that maturity. Didim, by contrast, is still being discovered and gains recognition year after year — and this earlier stage of the market cycle is the main factor supporting the long-term appreciation potential of zoned land.
5 · The currency effect: what is driving the increase?
By the area index, residential-zoned land rose +16.7% in TL over the past year and +31.4% over two years. How much of that is real appreciation, and how much is currency? Over the same two years the dollar rose 43.4% against the lira. Had the dollar stayed flat — stripping the currency effect out of the table — land prices are actually down 8.3% in dollar terms despite the visible TL increase:
If the dollar had stayed flat: two years of a 100-unit plot (Jun 2024 = 100)
Source: Endeksa Ak Yeniköy residential-zoned land index + USD/TRY (as of June 2026)
There are two readings. For the TL-earning domestic investor, the area has appreciated steadily for two years, and the index provider's forward 12-month estimate is +20.8%. For a foreign-currency buyer, the same area is cheaper than two years ago — a rare entry window in a place whose population, transaction volume and infrastructure are all growing. An average selling time of 86 days shows that window sits in a liquid market.
6 · Demand: what Google searches show
Alongside supply and transaction data we add a third layer: search demand. Google Trends indexes interest in a search term with the period peak set to 100 — no absolute numbers, but trends and ratios between markets are clearly visible. The chart below tracks Turkish searches for "didim satılık arsa" (land for sale in Didim) against the Bodrum and Kuşadası equivalents over 10.5 years.
Google search interest: "land for sale" — Didim vs Bodrum vs Kuşadası (2016-2026, monthly)
Source: Google Trends, Turkey, web search, monthly index (period peak = 100). Accessed 15.07.2026.
Five readings:
- Over the decade Didim attracts more than twice Kuşadası's search interest; its true peer group is Bodrum.
- The gap is closing: Didim outsearched Bodrum in only 6 of 96 months in 2016-2023 — but in 11 of 31 months since 2024.
- The pandemic break shows up here too: Didim's annual average index jumped from 25.6 in 2019 to 56.7 in 2021, exactly matching the 2021 parcel-activity peak in Section 2. Search interest behaves like a leading indicator of registry activity.
- The 2024-26 cooling is not Didim-specific: all three markets returned to pre-pandemic levels — consistent with the registry series, a sector-wide normalisation.
- Within the district, attention is shifting to Akyeniköy: the fastest-rising related query is "didim akyeniköy satılık arsa" (+70%).
Internationally, worldwide searches for "didim property" hit their 10.5-year peak in June 2026, led by the United Kingdom, Ireland and the Netherlands. Volumes are small and the series is noisy, so treat this as a supporting trend rather than a standalone finding.
7 · Official sales volume: 5,000-8,000 homes change hands every year
The second half of the demand layer is official sales data. According to TurkStat's district-level series, more than 90,000 homes changed hands in Didim between 2013 and 2025 — roughly one transaction per resident of the district. This is not a small seaside-town market; it is deep and liquid.
Didim — total house sales (TurkStat, 2013-2025)
Source: TurkStat, House Sales Statistics (MEDAS), district level. Accessed 15.07.2026.
- Annual sales have held a 5,500-8,300 band for 13 years — even in the harshest interest-rate years (2023-24) the floor never broke below 5,500. The demand base is structural, not cyclical.
- 2025 turned upward again: from 5,570 to 6,424, +15%. The first five months of 2026 started cautiously (1,898) — the rate environment still shows.
- Registry cross-check: the TurkStat housing series peaks in 2017, not 2021. This officially confirms that the 2021 spike in the registry parcel series (Section 2) was land/subdivision activity, not housing — one more piece of evidence for the "plot phase" thesis.
The foreign-buyer slice of the same series tells a different story:
House sales to foreigners in Didim and their share of total sales (2013-2025)
Source: TurkStat, House Sales Statistics (MEDAS), district level. Accessed 15.07.2026.
- In 2013, 1 in every 10 homes sold in Didim went to a foreign buyer (699 sales, a 9.9% share) — the tail of the British wave that began in the 2000s. By 2025 that number had fallen to 117 and the share to 1.8%: a 13-year low.
- The overall market, however, is solid: total district sales run steadily at 5,500-8,300 a year. Domestic buyers filled the space foreigners left — the price floor is carried by local demand.
- Combined with Section 6 the picture is striking: actual foreign purchases are at the bottom while international search interest is at its peak (United Kingdom, Ireland, Netherlands). That gap between interest and transactions, stacked on the currency window of Section 5, points to an entry period with the least foreign competition in years.
- Scope note: the TurkStat series measures home sales and excludes land transactions. District totals peaking in 2017 rather than 2021 confirms that the 2021 spike in the registry parcel series (Section 2) was land-driven — one more piece of evidence for the "plot phase" thesis.
8 · Conclusions: what the data says
- Didim's growth rests on permanent population; the district's land-parcel activity clusters in a single neighbourhood — Akyeniköy.
- By supply composition the area is still early on its development curve; land stock is broad, but the classic 600-700 m² villa plot is getting scarce and carries a premium.
- The price ladder between locations makes the return on maturity measurable; the Seyrantepe-Yeşiltepe gap is 24%.
- Despite steady TL growth, the area is cheaper in dollar terms than two years ago — for a data-minded buyer, the currency window is the most striking line in the table.
Get to know the areas
Sources & citation
- TÜİK, Address-Based Population Registration System (ADNKS), 2004-2025
- TKGM Parsel Sorgu Uygulaması, transaction-density analysis (accessed 09.07.2026)
- RedRock Properties, full Akyeniköy supply census (09.07.2026)
- Endeksa, Ak Yeniköy residential-zoned land index (June 2026)
- Google Trends, "land for sale" search-interest indices, Turkey (accessed 15.07.2026)
- TurkStat, House Sales Statistics — district-level sales to foreigners, MEDAS (accessed 15.07.2026)
This report may be quoted with attribution: "RedRock Properties — Didim Property Outlook 2026, didimproperties.com". Questions about the dataset and charts: info@didimproperties.com
© 2026 RedRock Properties · RedRock Gayrimenkul — All rights reserved.